Well I just spent another hour of my life (that I'll never get back) listening to the just released recording of the Alibaba December 2018 Quarter Investor Call.
1.) Revenue grew 41% from Q3 2017. MAUs and AACs (Customers) grew 20% over the same period. They did not distinguish, (at least that I could see) the difference between "newly consolidated" or "new retail" revenue from organic growth. Everything is still one big "blob".
2.) Cash and Cash "Equivalents" declined by $5.095 Billion USD from December 2017. Remember, in China (Unlike under GAAP and IFRS Rules) Cash "Equivalents" include demand notes payable from insiders, party members, off shore Shell-Companies and executive family members, whether they have gambling/drinking problems or not.
3.) Property & Equipment, (net) purchases were US$1.456 Billion in the quarter. (With No mention of what it might be comprised of) That would make property acquisitions during the (3 month) quarter the rough equivalent of the cost to build the Burj Khalifa. (i.e. the tallest building in the world) Impressive indeed, but if I were a BABA investor or analyst, I might like to have a bit of "color" describing what this gigantic, material increase was.
3.) SBC (Share Based Compensation) continued on the unprecedented trajectory, US$1 Billion for the quarter (25% of income). Management's benevolence with US Shareholder money to CCP members, insiders and their Off-Shore Shell Companies continues to have no bounds. (pg. 27 of the Press release)
4.) The only mention of Ant Financial's operations (Page 12 of the Press Release), the biggest elephant in the room, anywhere in the documents was:
"During the
quarter, we did not recognize any royalty fees and software technology service fees under our profit sharing
arrangement with Ant Financial. In the current quarter, Ant Financial continued its strategic investments to
acquire new users and capture growth opportunities in the offline payment market. Currently, Alipay and its
affiliates have over 1 billion annual active users globally. In the coming quarters, Ant Financial expects to
continue investments aimed at capturing the strategic opportunities amid the digital transformation of
China’s real economy."
Perhaps an analyst asked a question about this and I may have missed it, I nodded off a couple of times during the recording. If so, forgive me. To my ears, Daniel Zhang's calm, serene, angelic voice sounds a bit like the ocean and it lulls me to sleep.....but I digress.
So Ant Financial, with Alipay's 1,000,000,000 active users is not making any money for all their effort..... and may indeed be losing money, perhaps boatloads of money if their loan underwriting is anything like Alibaba's accounting.
It's rumored that the following Analyst Comment re: Ant Financial was made off-the-record shortly after the close of the Investor Call:
5.) Alibaba Management also managed to write up yet another US$2.4 Billion (about half of their current quarterly income) as a result of "Deemed Disposals & Revaluations" (pg. 27 of the Press Release). By comparison, US$2.4 Billion is the rough Construction cost of eight (8) Trump Towers at US$300 Million apiece, built in just one quarter. There is no description of the "write up" transactions or what the accounting treatment or source/citation might have been that requires or necessitates the write ups. I would think it might be interesting, especially to savvy Alibaba investors, to know and understand what skyrocketing economic value might actually prompt write ups of this size. (See UPDATE 1/31/19 below - Correcting my error/omission above. This Write-Up was discussed peripherally in the Presser and 6-K)
6.) During the presentation, the Alibaba Crew again raved about the success of their "Luxury Pavilion".
"During the quarter, brands including Valentino, Ermenegildo Zegna, Stuart Weitzman and Sergio
Rossi opened Tmall flagship stores and joined our Luxury Pavilion. Launched in August 2017, Tmall
Luxury Pavilion now offers more than 80 brands. Products range from apparel and beauty items to
watches and luxury cars."
When you search the TMall site you see thousands of these "luxury" items listed with pictures and prices.....along with "0" in the "monthly turnover" and maybe a meager (handful) number of views and few/no reviews.
When you pull the financial statements from these "luxury brands" you'll see that, the maximum volume, at the most, that could possibly be derived from these sales, even if you credit Alibaba with the entire annual volume of "Asia" for the brands listed on TMall (For example: Yoox-Net-A-Porter aka Moschino http://www.ynap.com/ et al) you'd see that total sales can't be more than a few million dollars. The "luxury pavilion" sales on the Alibaba platform probably dosn't even come close to being material or relevant.
Conversely, there was again no discussion of the rapidly expanding TMall/Taobao "Court Ordered Troubled Asset and Bad Loans" division. I can't believe they once again left this high-growth arena off of the 6-K discussion.
So why would Alibaba waste valuable space on a 6-K and significant presentation time to even bother mentioning these goofy low volume "luxury pavilion" businesses and gloss over something like....Oh....I'don't know...acquiring $1.456 Billion in fixed assets (e.g. the Burj Khalifa) or describing a US$2.4 Billion accounting gain (Eight (8) Trump Towers) in the quarter? I sure wish an analyst would ask about THAT!
7.) Operating Costs for this "New Retail" gambit are apparently out of control. When we examine page 17 of the presentation, we can see expenses (Cost of Revenue, R&D and SG&A, all excluding Share Based Compensation) increased from 49.4% of revenue in the December 2017 quarter to 80.7% today. Alibaba management seems to be willing to pay an ever increasing, perhaps limitless, price for the next dollar of revenue.
8.) Questionable Assets (Investment Securities, Investment in Investees, Intangibles & Goodwill) increased a whopping US$10 Billion in the quarter. (That's 33 Trump Towers in just One Quarter folks!.....Yowzahh!!) Again, no real, rational explanation. This crap-olla just keeps going up. It's 58% of the balance sheet now....up from 0.0% in 2015.
9.) When we look at the Segment Income (Loss) we see that the only Segment making money is the "Core" Business. (Page 20 of the Press Release) The rest of the business segments (Cloud Computing, Digital Media and Entertainment, Innovation Initiatives & Other and "Unallocated") continue to lose US$2 Billion a quarter like clockwork. Total Segment Income actually decreased by 20% over the comparable year to date period in 2017. (2017 RMB 60,093 vs. 2018 RMB 48,139) It appears as though "earnings", for the Alibaba Management team is more of a theoretical concept than an action item or goal.
So....What did Mr. Market think of all of this?
He absolutely loved it! Up 7%!
Volume ended the day at twice the 30 Day average....36 million shares traded.....but it was actually on the low end of what you might expect. There have been many 50 million share plus days, usually on the way down. Now that the CCP has reestablished a pricing/value expectation, we can probably expect a pullback, but with BABA.....who the heck knows?
The above is exactly why you can't short this beast. My thesis has long been that the CCP funded "Caymans Crew" steps in and drives the price up just when you think the numbers are so silly that nobody would believe them. This is the same methodology the CCP deploys to support the offshore RMB trade. The RMB trades at 6.80:1 today but based on Mainland money supply expansion it should be the financial equivalent of a roll of Charmin tissue. Thank goodness Chinese currency is at least "squeeze-ably soft" and will eventually be put to good use by those unfortunate enough to be stuck with it.
The SEC, by design, has no jurisdiction and no ability to see who's making these trades. CCP trades are placed from off-shore accounts and the trail stops dead-cold with the impenetrable iron curtain of tax haven banking regulation. As far as the Treasury and the SEC are concerned these trades and support levels might as well be designed and implemented by extra-terrestrials. The source is beyond their jurisdiction. Here's a video clip (below) of the latest joint SEC and House Banking Committee Task Force meeting where they are trying to figure out exactly what the hell is going on:
In Summary
There is absolutely no doubt, at least in my mind, that this is the greatest, systemic and by far most entertaining financial fraud in history....the post WWI Wiemar Republic "paper mark" scam was good, but this Chinese money mess, as far as creativity, enormity and sheer chutzpah, absolutely leaves those cranky old German bankers in the dust. Of course, all of this was brought to you by our "heads in the sand", good old boy political and financial leadership......hey a guy's gotta make a buck!
UPDATE 1/31/19
My Bad.....one of my readers pointed out that the Press Release did indeed contain analysis of the Interest and Investment Income (net) Here's the text below (Page 12 of the Press Release). I can't believe I missed it. Too much fishing....LOL
Interest and investment income, net in the quarter ended December 31, 2018 was RMB11,560 million
(US$1,681 million), which mainly included a non-cash gain of RMB21,990 million (US$3,198 million)
arising from the revaluation of our previously held equity interest in Koubei when we obtained control in
December 2018. The gain was partly offset by impairment charges of RMB7,059 million (US$1,026 million)
on certain investments, as well as net loss arising from the change in fair value of certain equity investments.
So roughly 70% of Alibaba's Net Income for the Quarter was derived from a US$ 3.198 Billion write up of a money losing business. Nice.....
Let's talk about today's 30 Year T-Bond Auction.....fascinating stuff....
I normally don't have time to post as often as I have lately, but there's so much happening, I feel compelled to comment on it. Finance, when it works well, is relatively boring. It's "making the donuts" day after day, no comment needed. When finance doesn't function well, when there are so many odd, generationally unique, structurally cataclysmic events taking place, as is the case today, as an observer, hot topics abound. We're in a "target rich environment" as they say.
The 30 Year T-Bond Auction - 1/10/19....Ouch!
The 30 Year Treasury Auction was just completed a few hours ago...and it didn't go well. As you know our incredibly wealthy Uncle Sam was looking for a small 30 year mortgage (He tried to sell $16 Billion...30 Yr. bonds...a paltry sum in the grand scheme of things....chump change really) and as normal for really wealthy guys, he summoned the world's preeminent bankers and dealers over to his place (the "Treasury") and had them compete for the privilege of loaning him some money. Well, the general consensus was that these astute financiers were perfectly OK with giving Uncle Sam some short term "Payday loans" at some hefty interest rates, as per the recent T-Bill auctions, but they were really uncomfortable with giving old Sam a 30 year mortgage, locking their money up on anything close to what good old Uncle Sam was hoping for. Here are the results:
1.) BTC (Bid-To-Cover is the measure of interest in the auction. BTC = $ bids/$ accepted bids) was abysmal at 2.19. The average 30 YR BTC for 2018 was 2.4. Recent T-Bill (safe money) Auctions have had BTC's running at 3+. The BTC for Direct Bidders fell to 1.2. This auction probably should have been canceled for lack of interest.
2.) As far as we can tell, Indirect Bidders (Foreign Central Bank buyers?) bought most of the bonds: $9.2 Billion (57% of the Bonds). The grass is always greener I guess. The Indirect Bidder ratio was 63% for 2018 Auctions.
3.) The yield moved up slightly to 3.035% on the 3-3/8% Coupon.
4.) Direct Bidders represented 15% of the Accepted bids.
Of course Uncle Sam was probably pretty bummed out by this. His party was a flop and he most likely took it as a personal insult. Did I mention that our Rich Uncle Sam has become a bit of a belligerent wind bag in his old age? Lately, he's been going, well, a little berserk when he doesn't get his way.
Below is the transcript from the hypothetical (Dick Fuld Banker Speak Translator - BST) discussion that took place during the auction this afternoon:
Uncle Sam: "Come on guys.....buy these things....it's all guaranteed... risk free.....you'll get your money back....I promise!.....or if you don't buy 'em at least give me some competitive bids. Come on....the show must go on....This is bullshit...."
Bankers/Dealers: "I don't know.....we have so many better places to put our money.....given everything that's going on we really don't want to get into a 30 Yr. /Coupon at 3-3/8% at par value. Can't you just do more of those 2 month bills? Anything under a year is fine....we'll buy it all day. We can get 4% short term AAA debt in the Cayamans, Hong Kong, Luxembourg, Singapore, you name it, if you guys raise rates we're going to get killed on the 30 yr."
Uncle Sam: "C'mon Man.....don't you clowns remember 2009?....I saved your collective asses....I gave you the FDIC & opened the window, I shit-canned the Volker Rule, Glass Steagall, Dodd-Frank and got rid of all kinds of regulation.... and I even looked the other way when you clowns started doing all that off-shore shit in the Caymans and Luxembourg.....I made you rich.....you f&%ing owe me! I'll even loan you the money to buy this shit!........ Besides....I've got Powell in my back pocket...he'll buy it if you don't......what could possibly go wrong?"
Bankers/Dealers: " Geezzz....when this goes South are you going to bail us out? How about our jobs? Bonuses? Those are still "no touchies" right?"
Uncle Sam: "Of course, of course, come on, have I ever let you guys down before? If you can't trust me...who the hell can you trust? Those schmucks in Hong Kong and the Chinese banks aren't going to bail you out...."
Bankers/Dealers: (short pause while thinking about Dick Fuld, Jimmy Cayne and Angelo Mozilla, etc. etc....)
Saudi Banker - Representative from JPM: "I'm in for $1 Billion...."
Chinese Banker - Representative from NYB/Mellon: "We will do what we can...." (Thinking: is my jet ready? I gotta get out of here......Caymans for the weekend...)
Here's the problem......
Under normal circumstances, Investors understand the time value of money. They expect to receive a lower interest rate (compensation) for the flexibility of a short term commitment (a few months) than they would receive for 10, 20 or 30 years. Better said, they should expect a significant premium for a 30 year commitment. They expect that the Federal Reserve would keep their social contract with the American Worker and Investor and manage interest rates and the money supply, keeping inflation in check, while also keeping the economy (and asset values) chugging along properly and in proportion.... and like Goldilocks, everything should be just right.
This makes perfect sense in a "guaranteed" Treasury environment where there's (theoretically) no risk of default. The time value of money is a given. It's understood. The problem is that often, the math doesn't work. Investors lose faith. They lose faith in institutions, politicians, the FED, asset valuations and become conflicted by their own perceived inability to cope with the forever looming risk du jour. Like an attractive, young, bright, single woman who can't decide on which lucky young man she should settle on, in times of uncertainty, investors want to keep their options open. They shy away from any 10, 20 or 30 year commitments.
Generally, when there's a bit of uncertainty (or as I've described in this blog for the last few years, questionable asset valuations, global bubbles and misrepresentations, the likes of which have never been seen before in financial history) Investors, once they start to figure it out, of course, begin to look for a safe place, usually, cash, money market, short term high grade & government debt, etc.. They move out of risk assets (stocks/funds/low-grade-long bonds, etc.). They want to hide out until the mess blows over and things settle down.....but you all know that.
Wealthy foreign investors and Multi-National Businesses who can put their money anywhere, generally choose the most regulated, stable (and/or least taxed) financial systems, markets and vehicles, wherever located. They look for places around the globe to park money when their respective economies "hiccup". Historically, the US, the dollar and US government securities have been such a destination. "In God (and Uncle Sam) We Trust". Of course, when we see investors flock to T-Bills and short term government debt, they bid up the price (and push down the yield). People and institutions are willing to pay dearly to park money in safe places. When the world is in flames, I'd be happy to pay $1,001 for a one month $1,000 T-Bill (-1.2% Yield) if I absolutely know, with certainty, I'm going to get my $1,000 back in a month. That's how we get to 0% (or negative) Interest rates. People fight over access to "Will Rogers Money" ...they are more concerned about the "return of" rather than the "return on" their money.
Interestingly, this hasn't happened... yet. Yields on T-Bills are at about 2.5% and the 30 Year Long Bond is, as of a few hours ago, just over 3%.....we've got a "flat" yield curve.
Yield Curves - Today vs. the Last Three Recessions....
All data, except the yield on today's Auction (inserted ad hoc), is derived from Treasury.gov.
I've charted the current yield curve (1/10/19 Solid RED Line) and compared it to the "Great Recession" 12/31/07 Pre-CrisisYield Curve (Dashed RED Line) and the 12/31/09 (Slightly Healthier looking, more normalized, Post Crisis Dashed GREEN line)
When we compare the current curve to the curves prior to and following the Great Recession we note a couple of things.
1.) The slope of the curve today more closely resembles the "Pre Recession" curve than the "Post Recession" curve.
2.) The 30 Year Bond Yield held relatively constant at about 4.5% through the 2008/2009 Recession.
3.) When we look at the "Post Recession" curve, we see that the yield on short term Treasuries collapsed as dealers bid up the price of the notes and bills. Dealers/Investors at the time, apparently had no problem making low interest "Pay Day" loans to our Rich Uncle Sam in exchange for flexibility and his guarantee that nothing could possible go wrong. They were concerned about the "return of" not the "return on" their money.
We also note that the pattern is similar for the two recessions prior to the "Great" one.
When we examine the curves from the Dot-Com (2000-2001) Recession (below), again, we have a flat "Pre-Recession" curve with rates running between 5% and 6% for the length of the curve. The 2007 "Post Recession" curve exhibits similar characteristics as the 2008/2009 Post-Recession curve. The (Safe Money) short term yields collapsed and the long end of the curve held relatively constant at Pre-Recession levels (5.5%), about 2.5% higher than today.
Now let's take a look at my favorite recession, the 1990/1991 "Post Reagan Recession". At the time, I had been working my way up the corporate ladder and had just been given my first controller-ship. I was promptly handed both the "Crash of 1987" and the 1990/1991 Post Reagan Recession to work my way through. I had no idea what the hell was going on. Good times!
We can see that the Pre-Recession and Post Recession Curve comparisons are consistent with both the above 2008/2009 Financial Crisis and the 2000/2001 "dot-com" implosion.
We also note that the "Post Reagan" Pre-Recession Curve was again flat, with all rates hovering at about 8%, a full 5% higher than the flat curve today. Post recession, once again, we note that short term yields fell significantly lower (4% less...about half of the Pre-Recession yield) while the long term rates remained about the same as Pre-Recession levels (8%)
Again, thinking through what's happening today, if the curve shape holds, we can anticipate that once the flight to safety hits, short term rates will most likely move to zero or marginally negative (that "Will Rogers rule" again), while longer term rates will remain at roughly 2.5% to 3%....or GAP UP!. Unfortunately, because rates have been so low for so long, I'm not sure how much rate relief our friends at the FED will be able to give us.....or our rich Uncle Sam.
As Uncle Sam continues to go to the bond markets and starts to unload an increasing number of those awesome 10,20 and 30 Year Bonds, trying to finance his drunken sailor deficit spending, my guess will be that, like today, these bond issues will stumble a bit and will eventually fall flat on their face. Investors will demand that the "time value of money" must be restored.....so Uncle Sam is in the unenviable position where his Treasury holds the auction and private investors, dealers and banks are only willing to submit outrageous bids (by Uncle Sam's standards). If the bonds are to be sold, the primary (and perhaps only) buyer could be the FED.....the Treasury will be printing fresh American "Troubled Assets" and the FED will be implementing auto-TARP the second the bonds hit the street.....Ouch!
My Little Cheat Sheet... If you fully, really, truly, absolutely understand how bond math works, feel free to skip ahead to "What the 30 Year Auction Told Us Today...." Personally, I just find bond math fascinating to think about....
I've used this handy little chart (below) for years. Remember, common stocks are Voodoo and magic....stock pricing requires guesses about the business, management, prospects, products, projections, business models, opportunity, CEO persona, etc. It's lots of fun and really invigorating!
High Grade Bonds are just boring old math.....no Voodoo involved.
We know exactly how a Treasury bond/note is going to behave as interest rates change....unless that "risk free return" concept somehow goes awry.
The following comments refer to my "cheat sheet" below.....
(Note that these calculations are based on the Net Present Value - NPV of one coupon payment paid the end of each year. There are more sophisticated products/calculations which take coupon timing and exact days outstanding into account and accurately calculates the precise yield of a specific issue. You can make one quite easily on any spread sheet program. My "full" Cheat Sheet starts at an interest rate of 0.5% and runs to 20.0%. I've pasted the section from 2.0% to 5.0%. (today's relevant range) to illustrate. The "Cheat Sheet" is for illustration purposes only and should be "directionally" correct.....again, because of variables with each bond/note issue, it's more of a guideline than a rule...)
When you buy a bond, and hold it to maturity you are buying two things 1.) The present value (NPV) of the principal payment you'll receive down the road, and 2.) The present value (NPV) of the income stream (coupon payments) you'll receive on a periodic basis.
The "Cheat Sheet" below describes the NPV of the Principal Repayment and the NPV of the Coupon/Interest payments for a $1,000 principal invested at various terms from 1 yr. through 30 years. (I've omitted the "Bill" calcs for simplicity) You can see that as the term of the bond increases the present value of the principal repayment decreases. The greater the interest rate, and the longer the term, the more "discounted"and the less valuable the principal becomes. Using the 2% rate, $1,000 paid back next year (NPV $980.39) is worth much more than $1,000 paid back 30 Years from now (NPV $602.41), or discounted at 5% 30 years from now (NPV $377.36)
Further, at higher interest rates, the present value of the coupon income increases. At a 2% interest rate, the present value of the coupon stream on a 30 Year Bond is $447.93. It's $768.52 at a 5% Interest rate.
As a bond owner, if interest rates and inflation remain constant at 2% you get $20/yr. for "renting" your money out to Uncle Sam. After 30 Years, you've got a NPV of both the Principal Repayment and the Income Stream of $1,050.34. You're $50.34! ahead! ....and you've incurred zero default risk!
We also note, sadly, that as interest rates go up, bond holders get...well....to be blunt....killed. If I own a 30 Year Bond with a 3% coupon, and interest rates go to 5%, the NPV of my Bond Principal (To be paid back in 30 Years) decreases by $125. ($502-$377=$125) and I'm stuck with the 3% Coupon ($30/yr.) which would also be discounted at the "new" 5% rate, when I should be getting my 5% Coupon ($50/yr.). So a 2% increase in interest rates destroys $127 of my Coupon NPV ($588-$461 = $127). By holding the bond to maturity I lose $252 ($125+$127) or about 23% of the NPV of my bond. If I were to sell the bond I'd experience this $252 loss immediately, since my bond NPV is only worth $838 now....rather than the NPV of $1,090 I was expecting.
Note that on the way down the math actually works in reverse.....the NPV of the principal payment INCREASES and we get to KEEP the income stream from the higher coupon. So the value of my bond INCREASES by (about) 23% as interest rates fall 2%! If you bought a ton of 30 Year T-Bonds in 1991 and held on to them, you've done pretty well....your NPV on the Principal has increased substantially and your 8% Coupon is looking pretty good right now...and has been for quite sometime. Talk about stimulus!
After all of the above calculations, given that UST's are "guaranteed undefaultable", even though their NPV can change dramatically as interest rates move, they remain the ultimate collateral. Which, of course, also means that sharp traders and investors can design all sorts of awesome devices to lever up. Futures, swaps, derivatives, ETF's, etc. etc. are all designed to hedge risk, or amplify speculative gains (and unfortunately... losses). Then of course, we had to invent "Credit Default Swaps" which protect the holder of derivatives and related securities from default by the institution backing the derivative, which is tied to all of this guaranteed safe collateral. Let's just hope everyone knows exactly what they are doing.
To sum it up, that's why it drives me nuts when people say things like "what's the big deal...it's only 25 basis points"!....it's not the move in rate that causes the disruption....the problem is that the rate change impact is compounded over 10, 20 or 30 years and has an immediate, guaranteed impact on the NPV of the security as well as anything else tied or leveraged to it.
In other words Jay Powell has absolutely no idea what's going to happen when he announces an interest rate change. Nobody does....and nobody could.
What the 30 Year Auction told us today......
Last year in my discussions with my very knowledgeable, bond trader friend, Tim Bergin, we discussed why so many bond market transactions were "failing" as well as the possibility of a "gap up" in interest rates. You can read (or reread) the discussion here. Treasury Fails Revisited....
The "gap up" occurs when the price a buyer is willing to pay for a T-Bond drops significantly (and the yield pops) since the security has fallen out of favor and trust in the FED, the economy and the implied social contract, or all of the above, are broken. Like Cinderella, today, the 30 Year T Bond wasn't invited to the Prince's ball.
There are dire consequences to this. My guess is that we will be seeing this play out in future auctions on a regular basis. Once note/bond owners/buyers/holders collectively decide "hey...we need a better return" they bid less for the bonds and push the yield up. Possibly wayyy up.
At some point, the FED will no longer have control of interest rates. No matter how dovish FED policy becomes, once long bond holders even sniff the hint that debt will be monetized, interest rates will go where the debt owners (lenders) choose to take them. Either the time value of money will be restored to their satisfaction, or they won't buy the bonds (make the loans).
Here are two Dallas FED charts I really like. The first shows the total Federal Debt (Treasury Securities) outstanding over time. The second shows the aggregate debt in relation to par value.
Total US Debt Markets (Public & Private) are somewhere around US$70 Trillion now (or about 3x Us Equity Markets). "Risk-Free" Government Debt (UST's, etc.) are about $22 Trillion of the US$70 Trillion total. By definition, the $48 Trillion of "non Treasury" debt has at least some level of default risk. These notes and bonds may (or may not) have been underwritten properly and may (or may not) have a proper risk premium attached. In any case.....it's not "chump change".
It's also interesting to note that for the first time since 1995 (Chart 3 Above) the Market Value of government debt has dipped below par value, which would be expected in periods of rising interest rates (see circa Volker days) even though the FED Funds target has only increased 2% in the last two years. We're seeing more debt bought/sold at a discount to par than any time in recent history, again due to the impact higher interest rates have on the NPV of longer term debt.
So....Why is the Stock Market Selling Off? and why will the Sell Off continue?
I know you want answers, you deserve the truth....I just hope you can handle it...
As I've described above, people who really, truly understand what's happening, know that the Bond Markets (eventually) set long term interest rates, not the FED. Our Rich Uncle Sam has been borrowing money from us (Investors) via the Debt Markets at an ever accelerating pace. Like you, me or our businesses, when we are employed, sales are up, we're successful, we have paid down our debts and have some savings in the bank, lenders are clamoring to loan us long term money (mortgages, car loans, business loans, etc.) at favorable rates. They trust us. When times are tough, perhaps we're between jobs, we've not been wise with our money, had a bad break or two, or we've acted like drunken sailors on leave, lenders decline our loan requests and saddle us with higher interest rates, fees and usurious "Pay Day" style options. They raise the rates and fees because there's an increasing probability they won't be paid back. (i.e. we'll default)
Now, remember those charts above? The flat yield curve with the bottom dropping out of the short end (Pay Day Loans) when times get tough? We also see the long end (20 yr. & 30 yr.) "Gapping Up", as it did a teeny tiny bit today and when lenders (Debt Markets) require ...you know....a little something for the effort.....other than "total consciousness".
When we look at the balancing that's been done over the years we see that, to elaborate, our financial leadership (Greenspan, Bernanke, Yellen and now Powell) seems to have backed us into a bit of a corner. The two Wharton Charts below (Wharton kids, for the most part, are pretty sharp cookies!) illustrate the problem pretty well. In 2007, Marketable Government debt amounted to $4.52 Trillion, of which $1.94 Trillion (43%) had a maturity of 4 years or more.
Now, let's fast forward to 2017, described in the second Wharton chart below. Marketable Government Debt amounted to $14.38 Trillion, of which $7.2 Trillion (50%) had a maturity of 4 years or more. So today we have about $5 Trillion more longer term debt out there ($10 Trillion total) than we did "Pre-Crisis". Remember my "Cheat Sheet" above? All of this debt will have to be discounted, and the present value of both the principal and the coupon flows will be beaten down as interest rates rise. The longer the term of the debt, the more brutal the beating. Discounts on this debt will be exaggerated (and yields will spike) as they always do, until we reach some sort of equilibrium. Even the rating agencies (who normally don't pull their heads out of the sand until well after the insolvency or bankruptcy filing(s)) are beginning to take notice.
With perfect 20/20 hindsight, this problem would have been much easier to solve and unwind had our Rich Uncle Sam been less aggressive and issued short maturity debt rather than long maturity. It would have been much less painful to bring interest rates back up to normalized levels. Uncle Sam did exactly what any smart borrower would do.....he locked in favorable rates for as long as possible. The problem is....that the lender is the American people....it's us.....our Rich Uncle Sam screwed us....we American voters are not getting paid enough for letting him piss away our money.....he really got the best of us on that deal.
Again, with the benefit of perfect 20/20 Hindsight, I'd imagine that if all of the American savers, workers and retirees were still getting 4% on their really simple, straight forward "golden passbooks" and Certificates of Deposit and had been adequately compensated for the time value of their money, they wouldn't have blindly redeployed all of their savings into hot, indecipherable funds and vehicles brimming with risk assets which had those assets anonymously shipped off shore... and the world would have never become one giant "risk on" bubble....but I digress.
Today, the FED can only cut the Funds target so much (2.5%) by my rudimentary math. Of course, the debt markets can force the yield negative if the demand for safe money accelerates. After today's relatively pathetic showing on a paltry US$16 Billion Auction, the Markets are flashing the Treasury a pretty clear signal....They are saying....please stop.
Are we entering an era where we have a yield curve with 0% on the short end and 15% (October 1981) on the long end?.....since the market will soon be loathe to make a 30 year commitment? Or will Uncle Sam take the less embarrassing road and simply stop issuing long dated debt (Like they did in Circa 2002 thru 2006). Will our government financing be done on a Pay Day Loan basis forever?....will that be our only option?
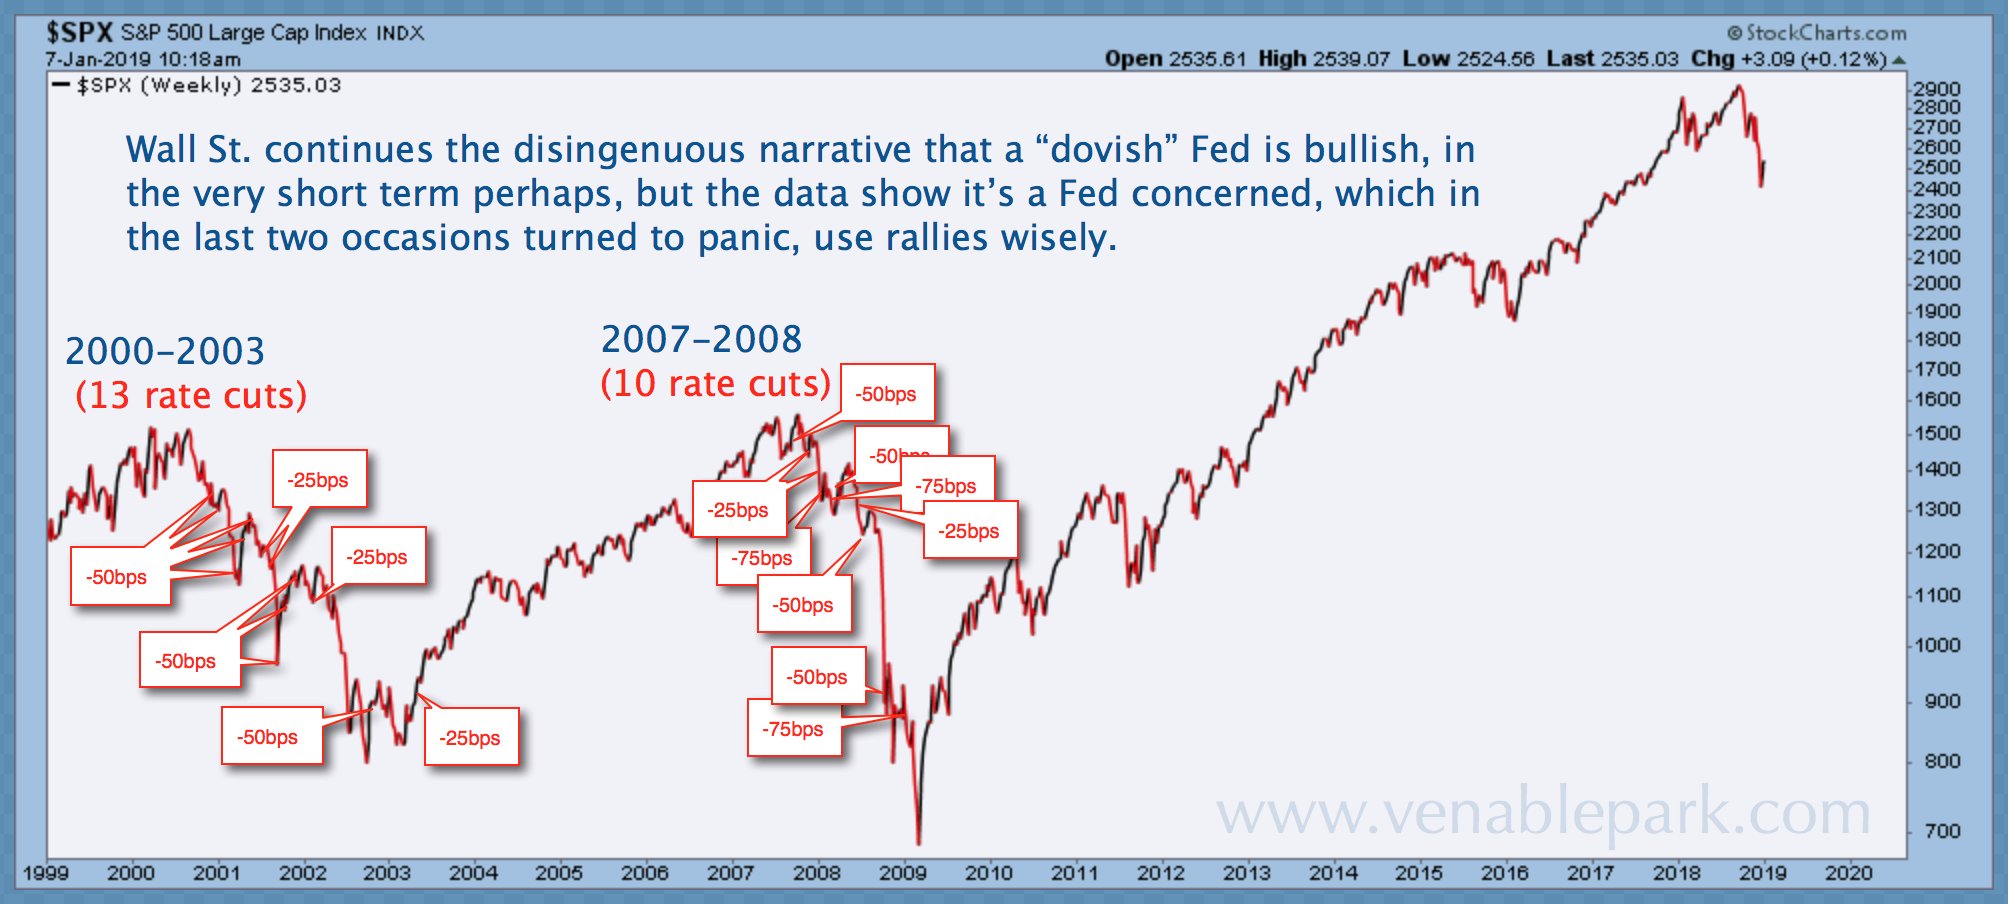
In the past, the FED has cut rates going into the recession/panic (see VenabalePark.com chart below) in an effort to stabilize markets and/or save the financial system. At a 2.5% T-Bill Yield I might question whether going back to zero would even be enough. If you've read my past work in this blog, the Chinese have "created" out of thin air, an additionalUS$50.1 Trillion of brand spanking new Financial Assetsthat are just a hiccup or two away from going bad.
As I peruse the after-market-close postmortem commentary and Twitter feeds from the talking heads every day, I can only emphasize that what's happening to markets today (both debt and equity), no matter what you are being told, even though it's incredibly entertaining, what's happening today has nothing to do with the Trade War, White House Tweets, the Wall, the Shutdown, Democrats, Republicans, Mexicans, Russians or Bob Mueller.....it has everything to do with a decade of horrific, politically motivated, easy way out, global monetary policy. And we are at risk of forfeiting the American Dream because of it.
Advice....
Finally, for all of you moon-phase watching, double shoulder fanatic, contango observing, "Buy the Dip", "Stocks ALWAYS go up in the long run", "Oooppsss I hit a rogue wave" dudes and dudesses out there who have somehow convinced people that you know exactly what you are doing and fully understand what's happening......You don't! This post was dedicated to you. I'm trying to help you.
You are continually told about the "strong economy" and that everything is going along just fine and dandy. You are repeatedly told about low unemployment (where everyone has three jobs just to get by, unless you work in healthcare of finance), low inflation (that's true, we may never have CPI inflation again, at least in my lifetime, since none of the monetary expansion has made it down to the "three jobs" people who would actually spend the money), average wages continue to rise (that's true as well, wage increases for six-figure finance and healthcare workers by far outpace the wage increases for the "three job" people). You absolutely should not be listening to this "everything is just fine and dandy" folly. We are already in the middle of a crisis, you just don't see it yet. Please take steps to protect yourselves and your clients if you can.
To be clear, unless you are a global titan of finance, you have no idea what the next 24, 48 or 72 hours holds in store for you, much less the next six months. (Hint: If you are running ads on Sunday morning local TV and/or holding "informational meetings" at Applebee's or Red Lobster trying to convince retirees and grandmothers to pony up their/your $10,000 minimum so you can "protect" their hard earned money....you are probably not a "titan of finance".)
I want you to really think about this and try your best to protect your and your client's money. This is not a "buy the dip....don't worry be happy" event....this is the beginning of an Armageddon-like financial meltdown of Biblical proportions.
Here's the last chart of the day....
Referring to the chart above. To sum up what's been happening over the last few months in both the bond and equity markets, it's an unmistakable flight to safety. Remember... "Smart" money, defined as that invested by "Titans of Finance" (higher volume RED BAR) "gets out" on the way down...."Dumb" money, defined as money invested by nice naive folks like you and me (lower volume GREEN BAR) continues to buy the dip....at least as long as they/we have money to buy it with.
Oh....and I almost forgot.....if you've been following my work you already know that because of China/CCP/PBOC monetary policy and the world's opaque off-shore banking system, the global financial system is also imploding....
Happy investing....and don't say I never warned you.....
Finally, I know exactly what you are about to ask......
You want to know how I can possibly write all of this analysis so soon after the results of the auction are published? Literally just a few hours ago? The answer is relatively straight forward. I wrote most of this last weekend when I had a little free time. I just filled in the details today, updated the charts and hit the publish button once today's Auction and Market Results came in. It's relatively easy to analyze things, and life becomes much simpler, when you are pretty sure you know exactly what's going to happen. I just can't tell you exactly when it will happen.
But I'm sure you already knew that I was going to say that.....
Over the holidays I've been asked by a number of my readers and friends to make an effort to simplify the issues I've been discussing over the last few years. One of the suggestions, from a very astute money manager/friend of mine was "Nobody get's it!.....could you just put the most important stuff in one chart or table with citations?"
My response, not fully knowing exactly how I was going to approach this pile of financial spaghetti, was...."I guess I can try..."
So here goes.....
If you want a 30 Second Summary, just scan the graphics and read the text in RED.
After making my iron clad commitment to simplicity, almost on cue, the PBOC, on December 28th, published the long awaited (several months overdue), English version of their epic, annual, "no problem...nothing to see here" Financial Stability Report.
As usual, it's a laugh out loud gut-buster of a document filled with classic economic humor and side splitting financial one liners. But, in keeping with the spirit and direction of my informal, reader focus group, I'm not going to attempt to dissect the entire 246 pages of the report.
I'll confess, I don't understand some of it. I've tried. Believe me, I've tried. The problem is, to be kind, that it's a compendium of silly flotsam and odd financial jetsam, set adrift in a sea of irrelevant drivel. There are probably nuggets of accuracy buried in it somewhere, but I've, as of yet, failed to identify them with certainty.
The purpose of the PBOC's Financial Stability Report, as far as I can tell, is to fully describe the financial condition of the Chinese economy and let the world know that "China" is on top its game and doing a great job ....at everything. All's well.....nothing to see here.
As you also know if you've been a long time reader of this blog, I've been really concerned about China's meteoric "Questionable Financial Asset" growth and the impact that it might have on the global economy.
Keeping with the new "Simple,Short to the Point" theme, I'm going to try to boil this entire mess down to a couple of Simple, Short and to the Point Tables, complete with page number references......here they are:
1.)In four short years the Chinese Government has "created" 380 Trillion RMB or US$ 50.1 Trillion (US$ equivalent) in Financial Assets out of thin air. The US$ (currency adjusted) value of these Financial Assets increased a whopping 22% in 2017 and forecast growth of 8% for 2018.
2.) The 2015 & 2016 figures include the "newly discovered" (Restated) Off-Balance Sheet (OBS) Assets disclosed in the 2017 Report (For YE 2016).
3.) During this incredible run, Non-Preforming loan ratios actually improved. Chinese bankers have always had a reputation as tough, relentless underwriters. (For you Chinese bankers reading this....that was what we call "sarcasm" in America). Here's the quote (pg. 60) "Downward pressure on assets quality alleviated. By end-2017, the total outstanding NPLs of banking institutions recorded RMB 2.39 trillion, an increase of RMB 195.7 billion y-o-y. The NPL ratio dropped by 0.06 percentage point y-o-y to 1.85 percent."
4.) In the 2017 FSR (2016 YE Data) the PBOC appeared to be extremely concerned about the OBS Asset growth. Here's the quote from page 48 of the report: "In 2017, the foundation for a resilient economy
and a sound financial market is still not firm,
the downside pressure on real economy
cannot be overlooked, and great attention
should be attached to the challenges and risks
confronted by the banking sector. The banking
sector will remain committed to the mandate
of contributing to the real economic growth,
attach more importance to risk prevention,
improve risk management and hold on to the
bottom line of preventing systemic risks from
happening." Since the time of this prophetic writing the PBOC has continued to "pay great attention"..."improve risk management" and try their best to "prevent systemic risks from happening"......by supporting Financial Asset growth at an annual rate of 14%! ....uh oh...
5.) By extrapolation and applying the demonstrated 2017 Financial Asset growth rate (quantifying the PBOC's commitment to financial austerity and tight money) to 2018 we can calculate/forecast that Chinese Financial Assets (as of yesterday) now amount to roughly 634 Trillion RMB (US$ 92.2 Trillion) or probably about 1/4th of all financial assets on the planet at current exchange rates.
6.) During the same time period the RMB has weakened by only 13%. (6:05 v 6:88)
7.) No economy, in history, has ever created financial assets, in equivalent reserve currency at this pace or level.....EVER.
Given the above, relatively shocking Asset Growth (even though the PBOC says "All's well...nothing to see here"), let's compare the above PBOC Figures to those previously provided to the Financial Stability Board for the Global Shadow Banking Monitoring Report. The FSB Figures (2014, 2015 & 2016) are taken from the 2017 Data Set. 2017 Data should be available in the March 2019 Report (2018 Data Set)
When reviewing the figures we note a significant disparity between the PBOC Financial Stability Report and those provided to the Financial Stability Board (Since the numbers are all being reported by the PBOC, one would think they should be the same). Here are the bullet points
1.) We note that the figures reported in 2014 were about the same (give or take a "Trillion" or two! US$ 40.0 Trillion vs. US$ 42.1 Trillion) At that time Chinese Financial Assets were roughly 12% of Global Financial Assets as reported by the FSB. Moving forward to 2016, the disparity grew to 20.6% vs. 14.4%. (The "newly discovered" OBS Assets)
2.) When we fast forward to 2018, extrapolating the trend and accounting for an estimated decline in Total Global Asset Values over the last month we can forecast, based on 2017 growth rates that Chinese, Mainland RMB Assets are now roughly 27% of all Global Assets. (in dollar terms as of 12/31/18).
3.) In the 2017 FSR (2016 YE Data) the PBOC attempts to explain the US20.9 Trillion disparity between their own financial asset figures, and those reported to the Financial Stability Board, while half-heartedly acknowledging the risk associated with the meteoric growth of mainland Shadow Banking. Here's the absurd quote found buried on page 151. "Such business is of low transparency and is easy to evade regulatory requirements for loans. Moreover, part of the money is invested in prohibited areas and most of the money is not yet covered by statistics of the TSF (Total Social Financing)" I believe that what the PBOC FSR is saying is that they don't include significant Shadow Bank Assets in their reporting to the to the FSB. Like most things Chinese, if it makes them look bad....they leave it out...
In other words, there's a good chance that, at the current exchange rate, Chinese Asset Values now exceed total US Financial Assets at the end of 2018 (Total US Financial Assets were US$90.2 Trillion as of 2016 per the FSB data Set). How could this happen?.....because very little is written off or written down. Bad Assets are rewritten, refinanced, rolled over and/or revalued. US$ Trillions are locked into far from liquid, vacant, overvalued residential real-estate, mortgages and wealth management products tied to same. There's no such thing as a default or a non-performing loan or WMP in China.
Why Are the Numbers Different?
From my perspective, the numbers produced by the PBOC in their "Financial Stability Report" (an oxymoron if there ever was one) should exactly match the numbers they provide to the Financial Stability Board. Total Bank Assets and Off Balance Sheet Assets are specific terms with specific definitions, yet, the figures seem to "jump around" and differ by tens, or even hundreds of Trillions of RMB depending on the document/source. There are a number of possible explanations for this....here they are:
1.) I'm (DeepThroatIPO) making a mistake in my reading of the reports and really don't understand what I'm looking at. There could be some sort of definition issue or translation problem which causes the Trillions of dollars of differences in the figures and there's a simple answer for this anomaly. Everyone who matters is already aware of it and I'm last to the party. (I doubt it since the PBOC Report was just issued last Friday night). If any economist or banker out there has a handle on what's really happening, or if you believe I'm dead wrong, I'd love to hear from you.
2.) The PBOC has a "second set of books" that they provide to the Financial Stability Board. This also makes perfect sense, you know, just like the silly filings on the US$2.733 Trillion (Feb. 2018 valuation) of goofy Chinese IPOs on US Exchanges. I'm told "Dual Bookkeeping" is nearing epidemic levels in China.
3.) The PBOC simply has no idea what it's doing and just "makes shit up". None of these numbers are actually calculable or accurate from the mish-mash, duct-taped-together financial systems they've conjured up and they just want to issue a rosy, feel good report for all the world to see. "Assets" are a good thing....right? The "trillions" could also be typos, slipped decimal points or mistakes, as been posed by a few of my troll-ish readers. As a rebuttal, I'd suggest that typos and math errors are occasionally acceptable for bloggers, journalists and pundits, but they shouldn't be present in Central Bank documents.
4.) The PBOC reports are politically motivated propaganda tools disbursed by the CCP. The authors simply report big, gigantic, impressive numbers that they believe Xi wants to see, so they don't end up in one of those Xinjiang region re-education camps along with the Uighurs. Avoiding re-education is most likely a primary career objective for most Chinese Bankers and Economists nowadays.
The point I'm making is that the idea that these disjointed, nonsensical, inconsistent, figures could possibly be accurate, reliable or free from bias is laughable.
TO BE CRYSTAL CLEAR, SIMPLE, SHORT AND TO THE POINT.......IF THE PBOC FSR IS ACCURATE, THEN THE FINANCIAL STABILITY BOARD REPORT IS DEAD WRONG! THE FSB REPORT WOEFULLY UNDERSTATES THE LEVEL OF GLOBAL ASSETS, DUBIOUS SHADOW ASSETS AND THE INHERENT RISK OF DEFAULT ASSOCIATED WITH SAME. THERE ARE ROUGHLY US$ 28.2 TRILLION ($92.2T-$64T) OF FINANCIAL ASSETS OUT THERE (AS OF YESTERDAY) THAT THE WORLD'S CENTRAL BANKERS DON'T KNOW ARE THERE, NOR DO THEY UNDERSTAND THE SIGNIFICANCE RE: MONETARY POLICY
The Relationship of China's Financial Assets to "Fake" GDP
Here's a nice graphic I like, describing 2017 Global GDP by region/country.
Focusing on the period from 2014 thru 2017:
In 2014, China GDP was US$10.48 Trillion compared to Total Financial Assets of US$42.1 Trillion (i.e. Financial Assets were 4x GDP). By 2017, China GDP increased to US$ 12.24 Trillion and Mainland Financial Assets increased to US$85.3 Trillion (i.e. a multiple of 7x GDP)
As a point of reference US Total Financial Assets have been relatively constant at roughly 5x GDP (FSB figures) over the same time period.
The Simple Question is: How in the name of Paul Volker could any economy (China) create an additional US$43.2 Trillion (US$85.3T - US$42.1T) in Financial Assets in three (3) years, while increasing GDP by only about US$400 Billion a year. In the three year period from 2014 thru 2017 the Chinese economy created US$25.00 of new Financial Assets for every dollar of GDP. If we use PGDP (Productive GDP) in the ratio, it's probably about US$40.00 of Financial Assets per dollar of PGDP. How could this possibly happen?
The Simple Answer is: It can't! There You Have It!
Simple, Short and to the Point.....I invite you to read the PBOC report in its entirety. It's a hoot!
Here are just a few of my favorite quotes from the Executive Summary :
The economic and financial development and reform and the defusing and
tackling of major risks during the past one year have not only reduced financial
risks, improved stability of the financial system, laid the foundation for the
economic transformation and development in the next five years or an even
longer period, but also contributed to growth and sustained recovery of the
global economy.
Well.... based on the numbers, that's not exactly what I might have concluded. Apparently, they are looking for a "thank you" from the world?
The Chinese economy is going through the
transformation of high-speed growth to high-quality growth and structural
adjustment, thus some financial risks of a grey rhinoceros nature may still
come up.
I'm glad they are concentrating on quality over quantity, otherwise they might have created US$100 Trillion of junk assets rather then just US$50.1 Trillion. I also wish the PBOC wouldn't refer to the POTUS as a "grey rhinoceros". So disrespectful.
However, the fundamentals of the Chinese economy featured by the
large volume, huge market and strong resilience have remained unchanged.
The basic policy orientation of reform and opening up has remained and
will not change.
"Opening up?" Really? Do you have any Uighurs, Muslims or Tibetans working at the PBOC? Have you talked to any US Tech Companies about how open you are? Can your "regular" citizens transfer money offshore without a financial rectal exam? Can your workers move to a new Chinese city or take another job without getting CCP approval? Do you still bulldoze Chinese houses and throw the homeowners on the street when a crooked, connected party member developer wants to put up a high rise? Why are all of those journalists and college professors deported or re-educated? What exactly do you have against Canada? How about unblocking this blog on the mainland? Openness my ass.....Just sayin'......
That said, Chinese self reported Financial Asset growth doesn't make any sense. It could be that the PBOC FSR is accurate, or the Financial Stability Board is accurate or "none of the above" is accurate. In any case, managing intelligent, functioning monetary policy in this environment is not possible.
Right now, again if we were to guess, since China doesn't publish any real/believable numbers, debt service, at current mainland interest rates on US$92.2 Trillion of non-performing Financial Assets is rapidly approaching half of China's fake GDP. The assets might actually exist in some form, but if they do they are poised for monetization, their economic values to be inflated away (currently underway) or default over time. The only remaining question is, when will this devastation finally hit the exchange rate, properly reflecting the true value of the Chinese economy.
The Chinese Financial Cancer is now officially terminal and the malignancy has spread to every corner of the globe, thanks to the world's anonymous, offshore banking system and sophisticated Off-Balance-Sheet financial tools (Swaps, Repos, Cross Border Listings, FOREX Bonds/Notes/Loans, Cryptos, etc. and any other derivative tool our amazingly creative American, Japanese and EU Bankers can dream up.)
If you'd like to read more detail about how US Banks, Regulators and the off shore financial system have at best failed us, and at worst have been complicit in this debacle (for hefty fees), please feel free to peruse some of my prior posts. Here are two of my relatively recent, better efforts that you might enjoy.
This just popped into my inbox from a reader.....it appears that as the Chinese Equity Markets dry up, Chinese fraudsters.....I'm sorry....I meant to say "Chinese entrepreneurs" have continued to scour the world for dopey "China Dream" investors courtesy of US Investment banks. For the first time in history, at least that I'm aware of, a nation's "off shore" new listings & corresponding capital raises have actually surpassed that same nation's "on shore" raises.
In 2018, the capital raised by Chinese IPO listings in the US & HK (offshore) of US$40 Billion, was greater than capital raised on the mainland US$18 Billion.....again, these figures might all be suspect....but who the hell knows anymore..... That's right, an economy the size of China's is raising more equity money via off-shore listings than on-shore. Apparently, Chinese mainland investors have very little faith in their "entrepreneurs".
 3.) Property & Equipment, (net) purchases were US$1.456 Billion in the quarter. (With No mention of what it might be comprised of) That would make property acquisitions during the (3 month) quarter the rough equivalent of the cost to build the Burj Khalifa. (i.e. the tallest building in the world) Impressive indeed, but if I were a BABA investor or analyst, I might like to have a bit of "color" describing what this gigantic, material increase was.
  5.) Alibaba Management also managed to write up yet another US$2.4 Billion (about half of their current quarterly income) as a result of "Deemed Disposals & Revaluations" (pg. 27 of the Press Release). By comparison, US$2.4 Billion is the rough Construction cost of eight (8) Trump Towers at US$300 Million apiece, built in just one quarter. There is no description of the "write up" transactions or what the accounting treatment or source/citation might have been that requires or necessitates the write ups. I would think it might be interesting, especially to savvy Alibaba investors, to know and understand what skyrocketing economic value might actually prompt write ups of this size. (See UPDATE 1/31/19 below - Correcting my error/omission above. This Write-Up was discussed peripherally in the Presser and 6-K)